Want to create a flowchart online? MyDraw is one of the best graphic diagram software out there.
It’s really easy to create various types of diagrams including flowcharts and organizational charts.
MyDraw also includes many ready-to-use templates for flowcharts, organizational charts so you can make your flow charts QUICKLY.
You can easily get started by just editing existing diagram templates.
3 Main Reasons Why You Need MyDraw
Three reasons why you need MyDraw is for printing and exporting to PDF, importing your flowcharts from Excel, and working with an already built layout.
1. Printing and Export to PDF
2. Data Import
MyDraw is a versatile software that you can use for many tasks. One of the best features is being able to get data from various data sources. Specifically, you are able to import other flowcharts from Excel.
3. Automatic Layouts
MyDraw features strong support for automatic layouts that help you arrange your diagrams quickly and easily.
Automatic layouts are very important when you are working with large diagrams or diagrams imported from various data sources. The Automatic Layouts feature has many advanced settings that allow you to perfect the layout according to your needs.
MyDraw has a nice user interface, allows you choose various themes, and it works on Windows and Mac.
Friendly User Interface
MyDraw has a familiar user interface that is inspired by Microsoft Office. Even beginners users can it and get comfortable.
Themes
You can choose between several user interface themes, that are available to both Windows and macOS users.
This makes it possible to have the same user experience regardless of the operating system that you use and to also change the entire application UI according to your preference.
MyDraw Works on Windows and macOS
MyDraw is a cross-platform software that works as a native application under Windows and macOS operating systems. Native applications have many advantages over applications running in the browser including better performance, better user experience, and better productivity.
The three most commonly used types of flowcharts include:
- Process Flowchart.
- Data Flowchart.
- Business Process Modeling Diagram
Processed Flowchart
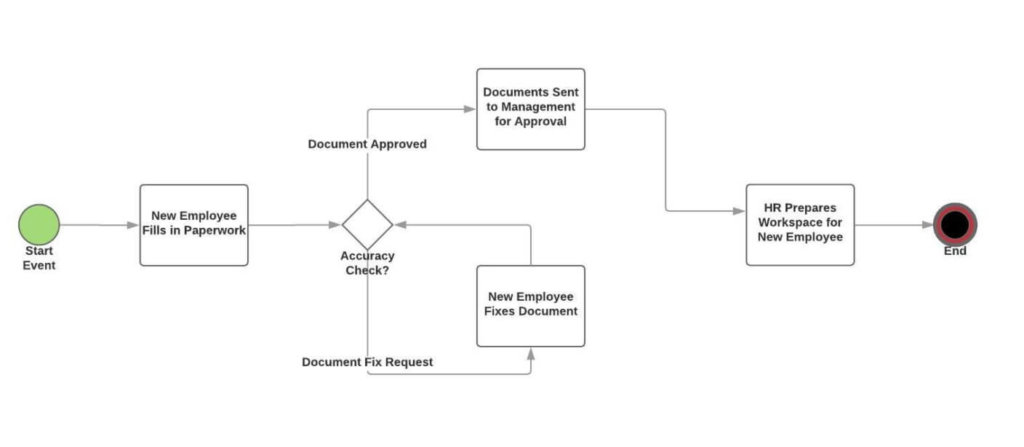
A process flowchart is a graphical representation of a business process. It’s used as a means of getting a top-down understanding of how a process works, what steps it consists of, what events change outcomes, etc. An example is:

A process flowchart like can easily be made with MyDraw.
Data Flowchart

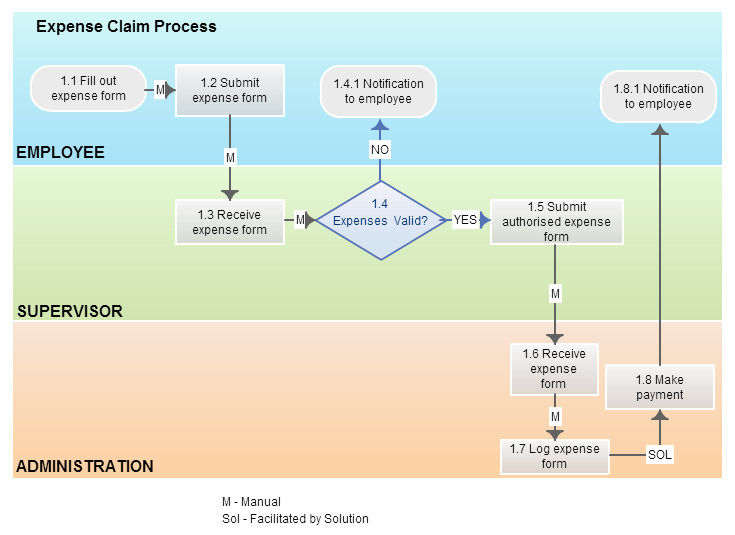
A data flowchart is a way of representing a flow of a data of a process or a system. It provides information about the outputs and inputs of each entity and the process itself. There is no control flow, no decision rules and no loops.
MyDraw allows you to use end-points of 1D-shapes (lines, arrows, routable connectors, etc.) to connection points and geometries of other shapes. This makes it possible to visually create advanced flowcharts that represent complex relations and hierarchies.
The build-in rich text editor in MyDraw allows for the smooth and easy creation of beautifully styled diagrams with exceptional text rendering quality and features.
Business Process Modeling Diagram
Business Process Modeling Diagram is a flowchart method that models the steps of a planned business process from end to end. It visually depicts a detailed sequence of business activities and information flows needed to complete a process.

In MyDraw, shapes are the primary building blocks of diagrams.The shapes are organized and you can use it to create your perfect diagram. Adding shapes to your drawing is easy – just drag and drop them on the drawing page.
Many MyDraw shapes have control points that allow the user to visually modify their geometry by simply dragging their control points. This makes it possible to further customize specific shapes according to your needs.
3 Tips for Better Flowcharts
1. Use Consistent Design Elements
2. Keep Everything on One Page
3. Flow Data from Left to Right
Why Use Flowcharts?
Flow charts are an important tool for visually displaying processes and conveying key information.
Why Do Companies Use Flowcharts?
By providing a graphical representation, flowcharts help project teams to identify the different elements of a process and understand the interrelationships among the various steps.
Buy
You can buy it HERE.
[convertkit form=1548253]


Be First to Comment